2. Understanding production operations
Production operations is the discipline of keeping software running for real users. Six dimensions: deploy safely, see what's happening, respond to failures, manage capacity, control cost, stay secure.
Operations is everything that happens after the code is deployed: watching the system for signs of trouble, responding when something breaks, shipping the next change without dropping requests, keeping the bill from drifting, and making sure capacity tracks demand. It's continuous; the work doesn't have a "done" state the way a feature does.
The DevOps shift was the decision to give that work to the same engineers who write the code. The case for it is straightforward: when you're the one paged at 3am, you write better error handling, you log more useful things, you don't ship a change on a Friday afternoon. The system gets better because the same person feels the consequences of the choices.
The software development lifecycle
Every feature moves through the same sequence of stages, known as the Software Development Lifecycle. The interesting observation for this chapter is where most book material stops (Deploy) versus where the real lifetime of the code is spent (Operate, Improve).
The SDLC describes the end-to-end journey of software:
- Plan: Define what you're building and why. Requirements, user needs, constraints.
- Design: Architect the system, choose technologies, design data flows.
- Implement: Write code, create tests, build features.
- Test: Validate correctness through automated and manual testing.
- Deploy: Release software into a production environment.
- Operate: Monitor, debug, scale, secure, optimize, and maintain the system.
- Improve: Learn from incidents, update the system, refine processes.
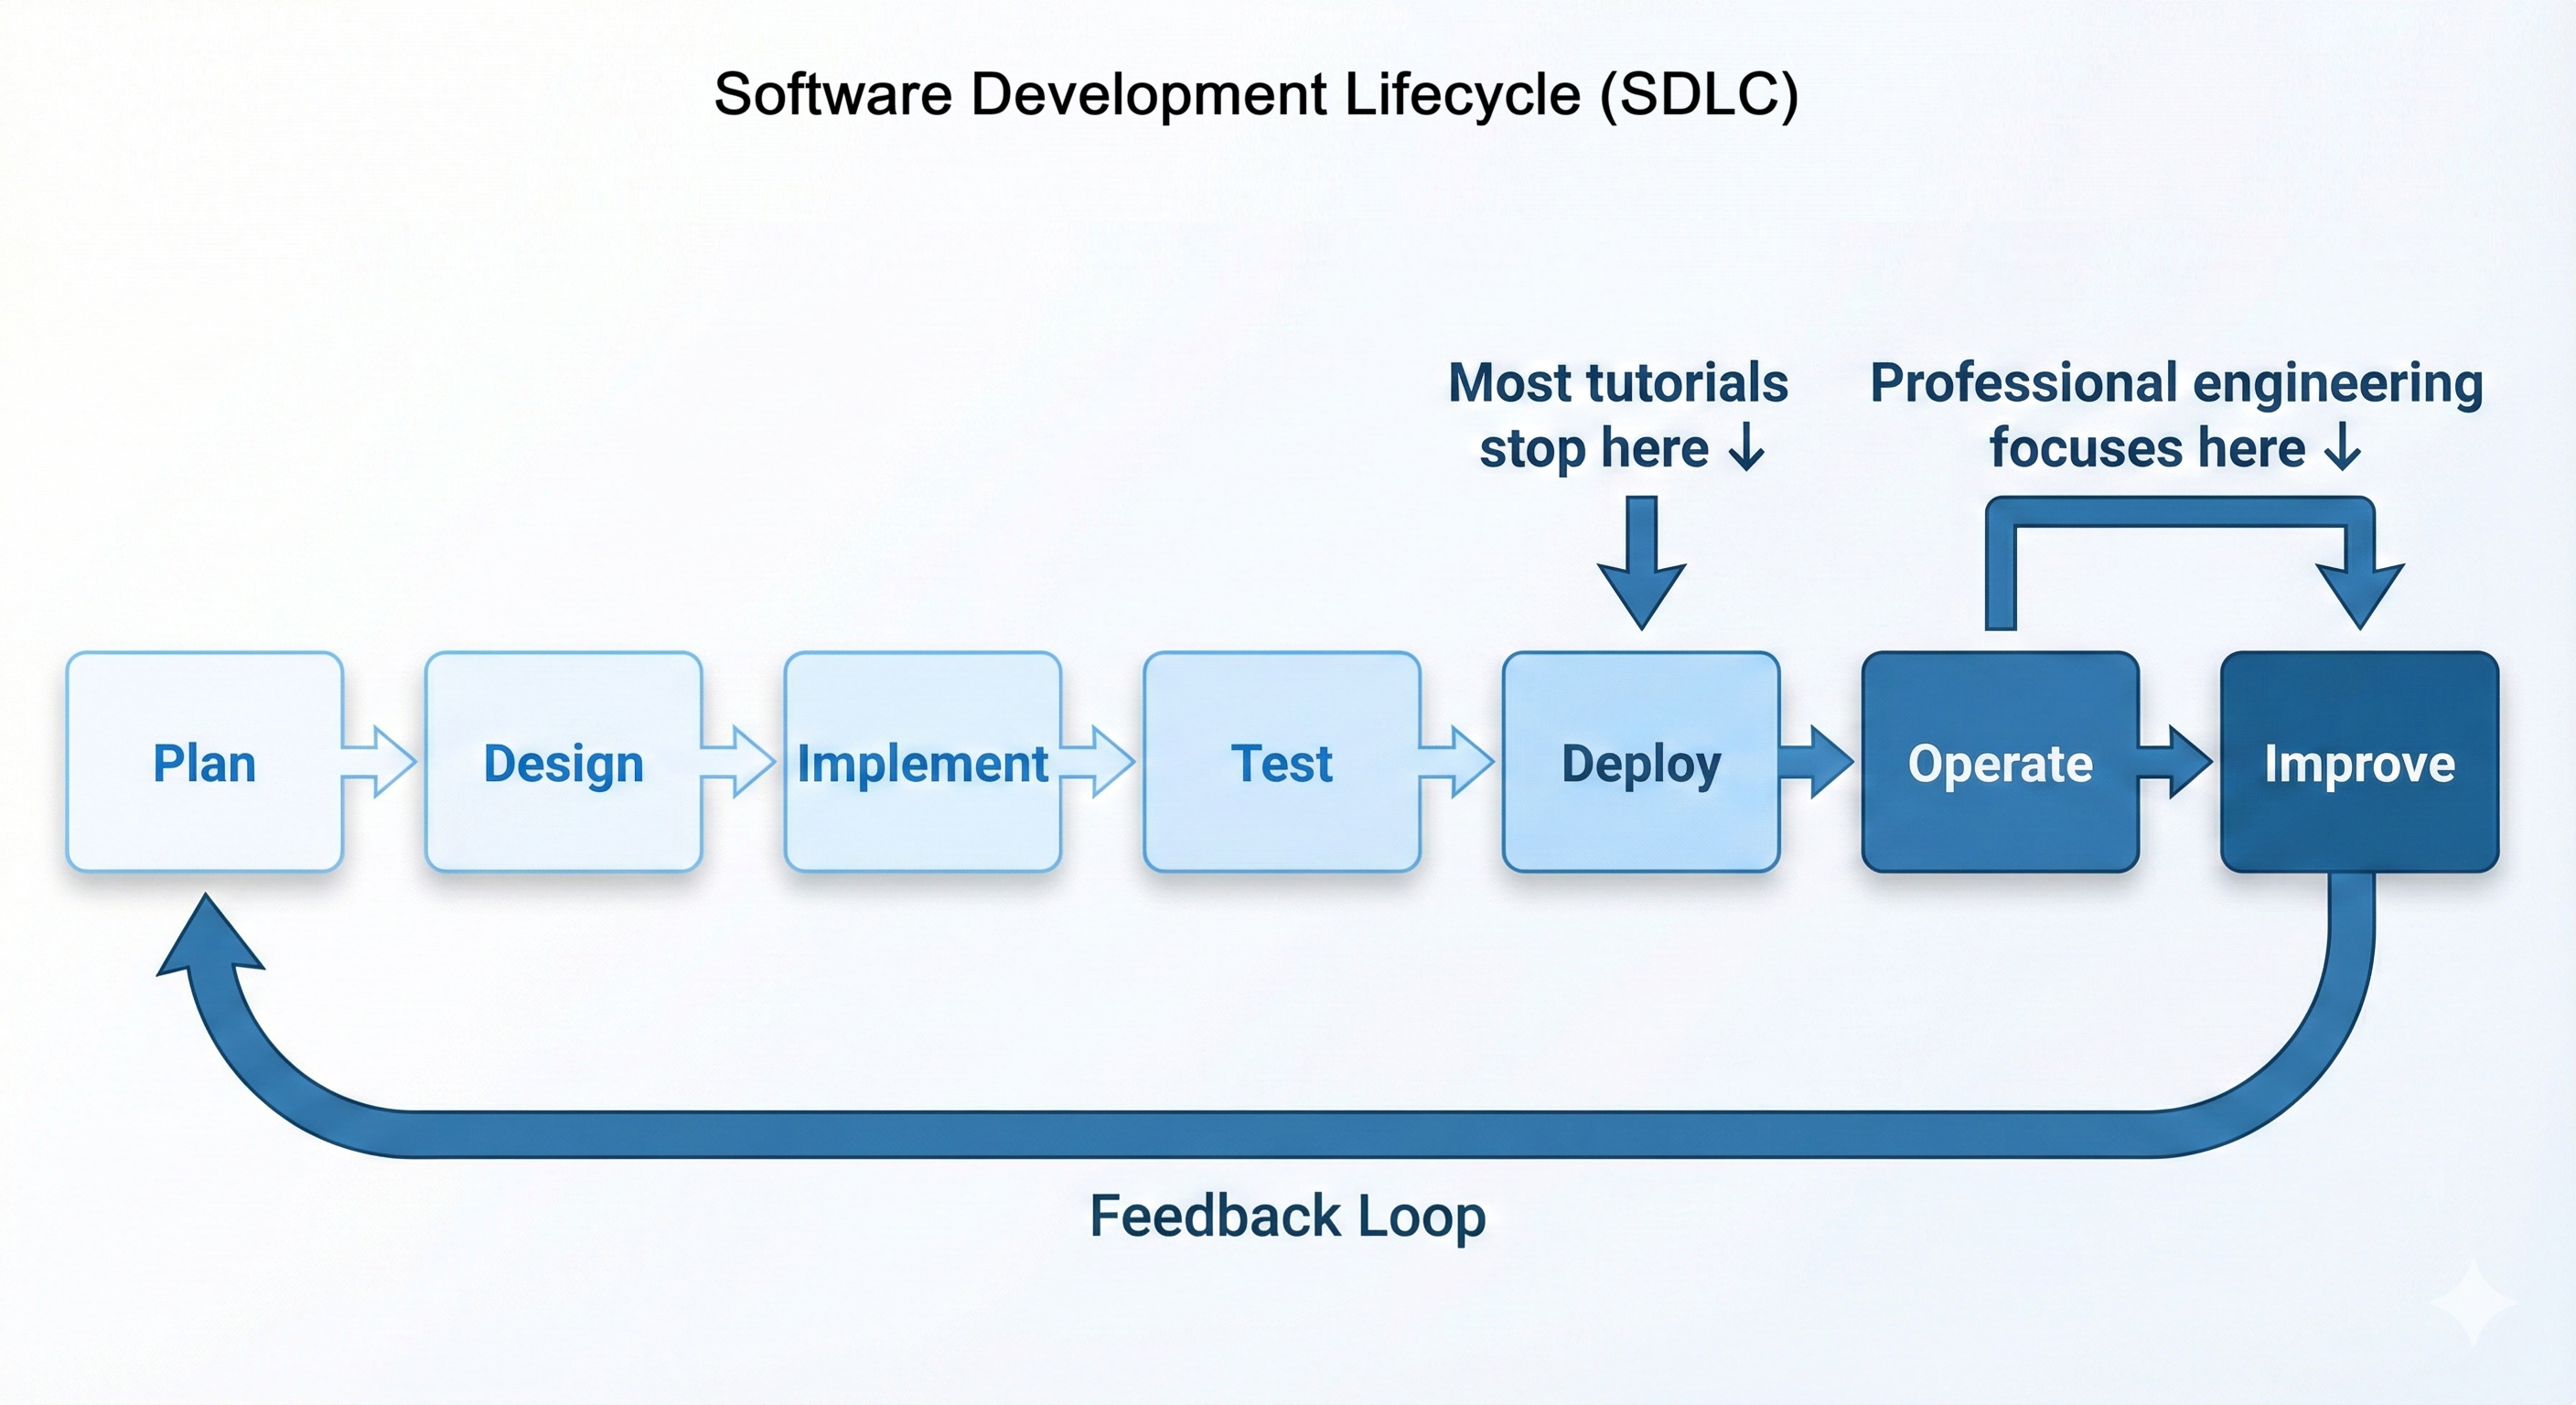
The Operate and Improve stages dominate the actual life of any deployed system. Reliability, cost, and user experience are all decided there, not in the design doc. This chapter is about the loop that lives inside those two stages.
The production operations lifecycle
Operations is a continuous cycle, not a linear process. Systems move through the same stages again and again as you deploy updates, respond to issues, and improve reliability.
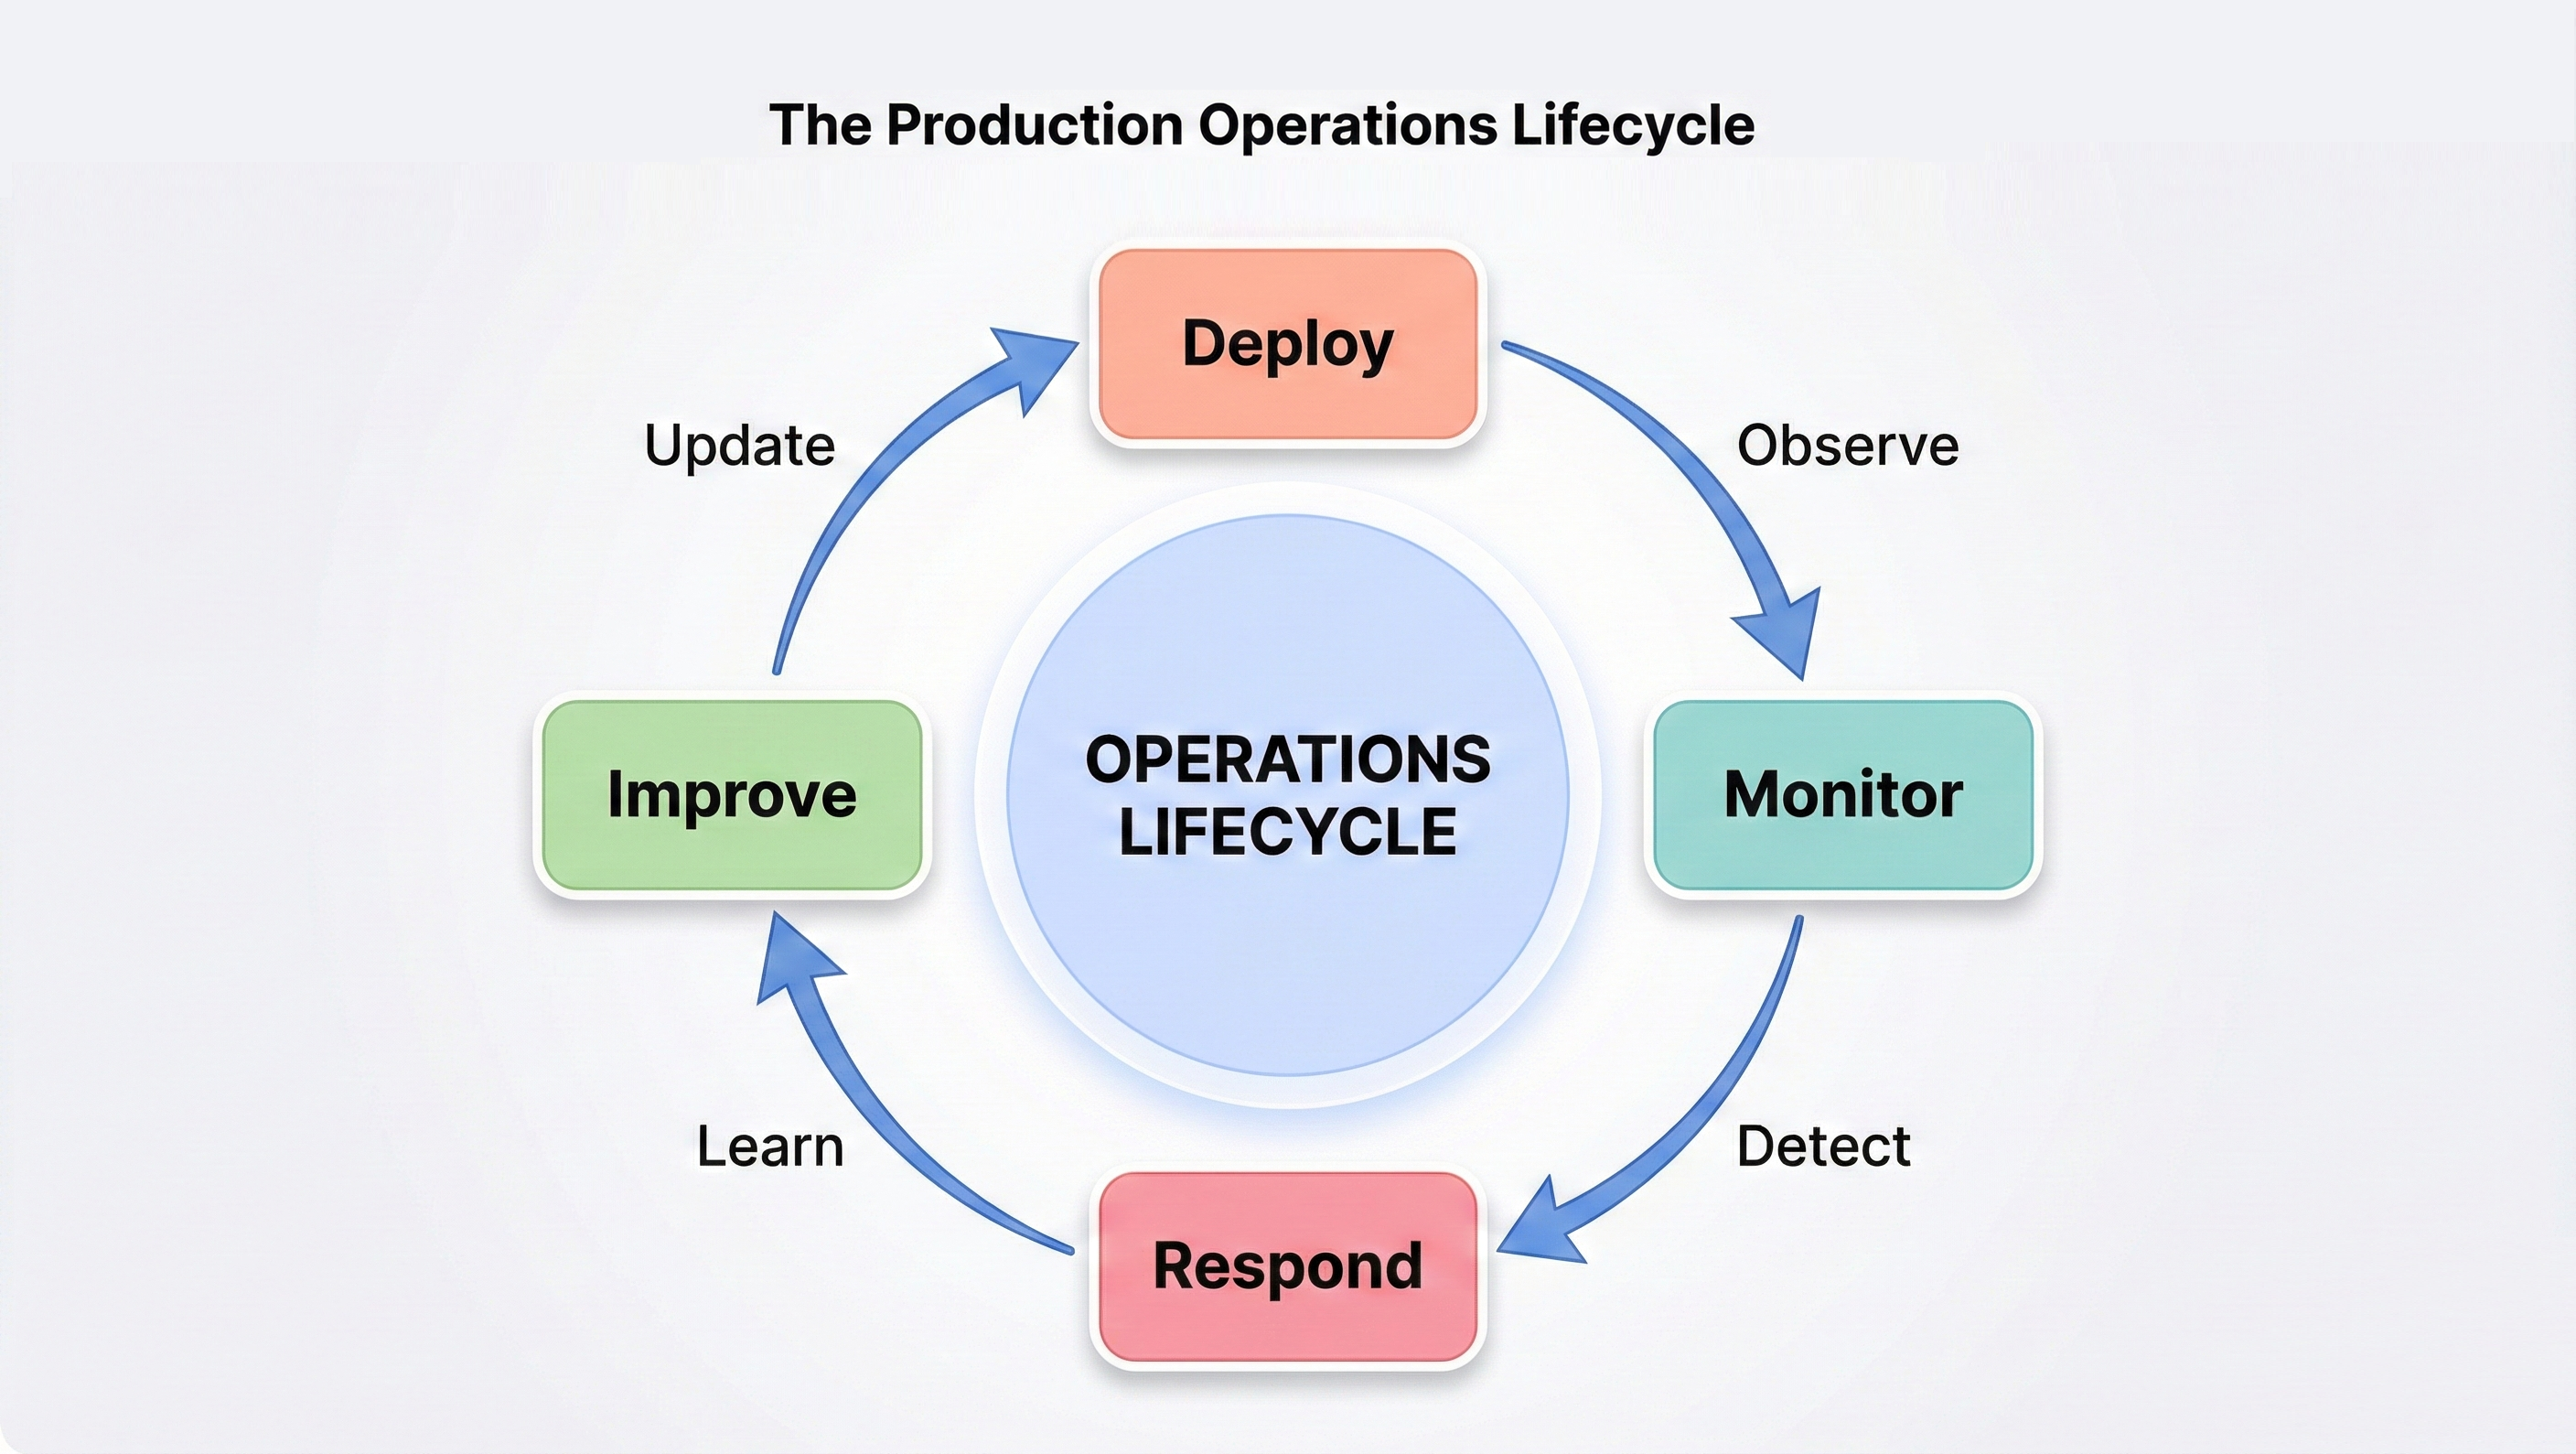
Deploy:
Get code changes running in production safely. That means building the artefact (the Docker image), updating the infrastructure (the ECS task definition), and verifying the result (health checks pass, error rates stay flat). Deployment should be boring; automation and automatic rollback are what make it boring. When deploying is boring, teams ship many small changes a day instead of one large change a week, and small changes are easier to debug and roll back.
Monitor:
Observe system behavior continuously. Logs show what happened (request received, query executed, error occurred). Metrics quantify behavior (requests per second, response time percentiles, CPU utilization). Distributed traces connect requests across multiple services. Good monitoring lets you answer questions like "Why are 5% of requests failing?" or "Which database query is slow?" without SSH-ing into servers or adding print statements.
Respond:
Fix problems when they occur. Production incidents happen: servers fail, databases run out of connections, traffic spikes overwhelm capacity, bugs manifest under specific conditions. Good incident response means detecting problems quickly (monitoring and alarms), diagnosing root causes efficiently (comprehensive logging), fixing issues correctly (understanding the system architecture), and preventing recurrence (improving the system or its monitoring).
Improve:
Make systems more reliable over time. Post-incident reviews identify improvements: better error handling, clearer logging, faster auto-scaling, improved monitoring. Capacity planning prevents resource exhaustion. Performance optimization reduces costs while maintaining responsiveness. This continuous improvement distinguishes mature operations practices from reactive firefighting.
The cycle repeats continuously: deploy new code, monitor its behavior, respond to issues, improve based on learnings, then deploy the improvements. This feedback loop is how systems become more reliable and operators become more skilled. Every incident is a learning opportunity; every deployment teaches you something about your system under real load.
Key operations metrics
Four numbers summarise how well an operational organisation is running. They're the ones that come up in postmortems, capacity reviews, and roadmap discussions, because they each describe a different failure mode.
Uptime (Availability):
The percentage of time your system is available and functioning correctly. 99% uptime sounds good but means 7.2 hours of downtime per month. 99.9% (three nines) means 43 minutes per month. 99.99% (four nines) means 4.3 minutes per month. Each additional nine requires exponentially more effort and cost. Most web applications target 99.9% or 99.95% because achieving 99.99% requires redundancy across geographic regions, which adds significant complexity and expense.
MTTR (Mean Time to Recovery):
How long it takes to restore service after an incident. Fast detection (good monitoring) and fast diagnosis (good logging) both help, but automated rollback is the single highest-leverage MTTR knob. If a bad deploy is the cause and you can roll back in seconds rather than chasing the bug, the incident is over in minutes instead of hours. Cutting MTTR from two hours to ten minutes turns the same set of incidents into a system the users perceive as reliable.
Change Failure Rate:
The percentage of deployments that cause incidents. If you deploy 100 times and 5 of those deploys cause production issues requiring rollback or a hotfix, the change failure rate is 5%. Zero is unattainable; healthy teams sit somewhere in the 5-15% range and get there by combining a real test suite, staged rollouts, and monitoring that catches regressions in the first few minutes after a deploy.
Deployment Frequency:
How often you deploy to production. The intuition that more deploys is riskier is backwards: frequent small deploys are safer than rare large ones because the surface area of each change is small enough to reason about and roll back. The bottleneck on deployment frequency is almost always the manual steps in the deploy pipeline; the CI/CD work in the next section is what removes them.
Operations as code
The opposite pattern -- SSH into a host, edit a config, restart a service, leave a note in a wiki -- doesn't scale. It isn't reproducible (two engineers configuring nominally identical services will make different choices), and it isn't reviewable (there's no diff to look at and no commit to revert).
Infrastructure as Code means defining infrastructure in version-controlled files. AWS resources (ECS clusters, RDS instances, load balancers) become code written in tools like Terraform or CloudFormation. Configuration files (task definitions, scaling policies) become YAML or JSON in Git repositories. Database schema migrations become versioned Alembic scripts. When infrastructure is code, you can review it, test it, version it, and roll it back like application code.
This chapter uses Infrastructure as Code principles throughout. GitHub Actions workflows are YAML files in your repository. ECS task definitions are JSON files. CloudWatch dashboards are defined in code. This approach makes operations reproducible (running the same code produces the same infrastructure), auditable (Git history shows every change), and reviewable (pull requests show proposed infrastructure changes before they happen).
In this book, you're not writing full Terraform modules, but you are treating task definitions, scaling policies, and CI/CD workflows as code, which builds the same muscle.
The benefits compound. New team members onboard by reading infrastructure code, not outdated wikis. Production problems are debugged by comparing current infrastructure to previous versions. Disaster recovery becomes running the infrastructure code in a new region.
Next, in section 3, we wire the first piece of Operations as Code: a GitHub Actions workflow that runs tests, builds the image, pushes it to ECR, and updates the ECS service on every push to main.